| Reverberation time, diffuse reflection, Sabine,
and computerized prediction - part I. Note: This is an old article (1999)
orginally published on the RPG web-site but the general principles hold for
v8 as well as v9 with TUCT. A few small updates made January 2022 e.g. to
use the term scattering coefficient rather than diffusion coefficient that prevailed at the time. Bengt-Inge Dalenbäck, Ph.D., CATT
0. Introduction This is the first part of a two-part on-line paper discussing reverberation time estimation with special emphasis on the effects of diffuse reflection in computerized prediction (CP) in relation to classical Sabine methods. The purpose of this paper is to discuss problems, pitfalls and techniques regarding reverberation time (RT) prediction and gives examples from idealized as well as actual rooms encountered in consulting practice. Reverberation time is far from the only measure a CP program can estimate and many further types of analysis are possible. However, the RT is a good starting point since it remains a central parameter in all applications of room acoustics and most acousticians would agree that an appropriate RT is a necessary if not a sufficient condition for good room acoustics. Part of what will be discussed here can also be found in a JAES article [Dalenbäck-94] and an IOA conference paper [Dalenbäck-95]. All CP examples shown are created using CATT-Acoustic™ v7.2. Part I addresses:
Diffuse reflection basically affects the RT in two ways, both in the decreasing direction: 1.1 Diffuse reflection forces surfaces to be more evenly utilized By redirecting the reflected sound in many directions, diffuse reflection will let room surfaces be hit by sound in a more uniform manner and absorbing surfaces will be better utilized. It thus prevents cases where the sound field e.g. becomes predominantly horizontal such as with hard parallel walls where a ceiling absorber does not have any major effect on the late decay. Clear examples of such cases are swimming and sports halls that often are rectangular and where the absorption for practical reasons is placed mainly in the ceiling and perhaps on upper wall parts. Another example is a reverberation chamber where the placement of an absorber (to be measured) on the floor requires the use of diffusing elements to give a good estimate of the random incidence absorption coefficient. Signs of the non-diffuse field in such rooms are double-sloped or otherwise non-linear (when expressed in dB) decay curves. This non-linearity is created because the sound in some direction (often the vertical) is quickly absorbed giving a fast initial decay (both due to the higher average absorption in the vertical direction and because vertical reflections occur more frequently - the height is often the smallest dimension). In contrast, the horizontal sound lingers since it is reflected between hard surfaces (and is also reflected less often), and thereby gives a slow late decay, see Figure I-1. 
a) vertically reflected sound 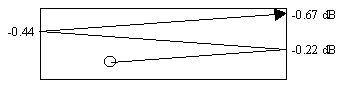
b) horizontally reflected sound Figure I-1 Schematic illustration of vertically and horizontally reflected sound in a rectangular room with a ceiling absorber (alpha = 0.80) and hard walls and floor (alpha = 0.05) assuming no diffuse reflection. Reflection traces are those occurring within the same time period (i.e. total length of rays are roughly equal). Numbers indicated are the remaining relative levels after each reflection (for example, 10 log(1-0.80) = -7.0 dB and 10 log(1-0.05) = -0.22 dB). The figure illustrates that - during the same time period - a vertical ray is attenuated by almost 30 dB due to absorption while the horizontal ray - in comparison - is hardly attenuated at all. With double-sloped decays the whole concept of an RT becomes ambiguous, especially if the knee of the decay is located inside the -5 to -35 dB span commonly used to evaluate RT (T-30). Figure I-2 illustrates the effects on the RT for scattering coefficients from 0 to 0.99 using an idealized rectangular room with an absorbing floor. 
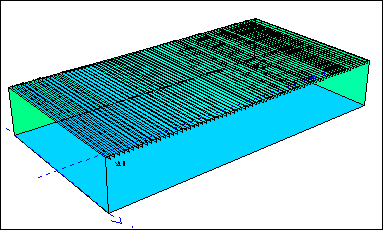
a) room model 24m x 12m x 6m. 
b) decay curves using various wall scattering coefficients. Figure I-2 Idealized room with 0.80 ceiling absorption and 0.05 on remaining surfaces. The Sabine RT is 1.04 sec and the Eyring RT is 0.90, predicted T-30 for a scattering coefficient of 0.99 is 0.85 sec. The RT values for degrees of diffusion can roughly be read off the time axis since the decay shown is 60 dB. In this example the mean absorption is 0.26 so with high scattering coefficients (> 0.40 ) T-30 is very close to what the Eyring formula predicts (rather than Sabine since it assumes a lower mean absorption). Of course, if a rectangular room with uneven absorption actually has very smooth surfaces there is very little diffusion and the decay will be double-sloped. However, as can be seen in Fig. I-2, the scattering coefficient should never be set to zero (unless the purpose is to test a room's sensitivity to diffuse reflection) since, if nothing else, there are wall impedance mismatches and edge diffraction so it is quite clear that with zero scattering coefficients, or if diffusion is not handled at all, the estimated RT may be much too long. The example illustrates the extreme dependence on diffuse reflection in some cases and that the assigned scattering coefficients then must be estimated more carefully. This estimation is a difficult task but experience from using frequency dependent diffuse reflection for 10 years in a CP program (CATT-Acoustic™) has shown that with some basic guidelines, to be given in Part II, very good RT estimates can be obtained also in "non-Sabine" rooms. 1.2 Diffusers introduce absorption of their own Diffusers also affect the RT by their own absorption, especially noticeable if a hard flat surface is replaced by a diffuser. This effect will not be further discussed and it is rather to be seen as the task of diffuser manufacturers to optimize their designs to give low-absorbing but high-diffusing alternatives where such are required or to offer particular combinations of absorbing and diffusing properties useful for specific purposes. 2. Will diffuse reflection always decrease the RT? No, not always (but it may of course alter many other subjectively important parameters): 2.1 No, not with a "mixing" room shape If the overall room shape and sizes and orientations of surfaces are such that they will cause reflections to be well "mixed" for purely geometrical reasons a diffuse field may be created even if no rough or diffusing surfaces are used. The introduction of diffusing surfaces will change the room responses even for a mixing room shape in many psycho-acoustically significant ways, but they may not alter the RT much. 2.2 No, not if the absorption distribution is even and the room dimensions are similar In addition to diffuse reflection, the two
major parameters determining the RT are the mean free path (mfp) and
the mean absorption coefficient. The mfp is little dependent on room
shapes and scattering coefficients and the classical value of 4V/S
is a very good estimate. This means that with an even absorption distribution
(i.e. all surfaces having similar absorption values within each octave-band)
the actual RT is often very close to the classical Sabine (or Eyring if the
mean absorption is higher). An exception to this is if the room aspect ratio
varies (very long, very flat etc.) then diffuse relfection can have an effect
even if the absorption is even. However, as soon as there is an audience in a room there is bound to be an uneven distribution, especially at high frequencies (wooden walls say 0.05 and audience say 0.80 as used in examples here) while at low frequencies the values are more similar (wooden walls say 0.15 and audience say 0.35). From these two cases it can be seen that the most sensitive case is a non-mixing shape with uneven absorption where the actual measured T-30 sometimes may be 2-3 times longer than that predicted by Sabine. Figure I-3 illustrates this case by using an actual sports hall.
Figure I-3 Sports hall 43m x 23m x 7m. RT @ 1 kHz according to Sabine was 1.9 sec while the actually measured T-30 was 5.7 sec. Sports hall project background: The acoustic consultant involved (Akustikon, Sweden) recommended to place class A absorbers between every second beam pair in the ceiling (ca. 50% coverage giving an effective ceiling absorption coefficient of 0.43 @ 1 kHz) and additional high absorption on at least one end wall and one side wall. However, to save money the contractor instead chose to use only the ceiling absorption and leave the rest basically as concrete (and it had later to be corrected - but that is another story). With only the ceiling used for absorption the calculated Sabine RT @ 1 kHz was 1.9 sec but when the RT was actually measured it was 5.7 sec. This is a clear case of a non-mixing shape with uneven absorption and this sports hall will be used again in Part II to show that the actual RT can be well predicted by selecting proper scattering coefficients, as was also done by the consultant. Note that this case is also affected by uncertainties regarding absorption coefficient values (further discussed in Part II) but any such uncertainties would result in a much smaller error than that caused by using the Sabine formula. The sports hall is an extreme case but there are numerous cases that have similar, if not so extreme, properties. Concert halls and auditoria have one dominating absorbing surface (the audience but it is also - luckily - diffusing) while remaining surfaces are for the most part reflective and it is not uncommon with fairly rectangular shapes or large parallel side walls. Classrooms are other examples of non-mixing room shapes where a dedicated absorber often is placed in the ceiling while remaining surfaces are fairly hard (desks and chairs will have a diffusing effect (using auto edge scttering) but often not sufficient to completely prevent a non-linear decay). It should be mentioned that halls sometimes are deliberately designed to have a short early decay time and long late reverberation (e.g. by the use of reverberation chambers or otherwise coupled volumes) but that is quite different from making a faulty prediction of the expected RT in a room not realized to have a double-sloped decay. 3. What effect has diffuse reflection on Sabine RT estimates? As indicated above the Sabine and Eyring equations both assume that reflections are fully diffuse and that each surface is visible from all other surfaces so that the utilization of the absorption of a surface can be considered to be in direct proportion to its relative area. This means that the classical equations cannot be expected to give good estimates unless a large fraction of the room surfaces are diffusing or if the room shape is mixing. 4. Will not formulas such as Fitzroy and Arau-Puchades solve the problem? Alternate RT equations is the topic of a large number of journal articles and conference papers, many of which attempt to find a catch-all equation for RT estimation. Two such attempts to improve on the classical Sabine or Eyring formulas are those of [Fitzroy-59] and [Arau-Puchades-88]. These two formulas give a better estimate than the classical formulas in some cases but here a central question is: how can one be sure they are better in a particular case? So far no equation with universal applicability has been shown. It is conceivable that better equations can be developed by analyzing rooms in more detail (surface size and orientation statistics, absorption and scattering distribution etc.). However, any such attempt would require a computer model of the room to be made for the analysis and with a computer model of the room the decay can be estimated directly by a CP program using geometrical acoustics (ray-tracing and variants thereof) and a formula is not necessary. Such an estimate requires diffuse reflection to be taken into account in a sufficient manner, a topic to be discussed in Part II. References, Part I [Fitzroy-59] "Reverberation formula which seems to be more accurate with nonuniform distribution of absorption," D. Fitzroy, JASA 31, 893-897 (1959) [Arau-Puchades-88] "An improved reverberation formula," H. Arau-Puchades, Acustica 65, 163-180 (1988) [Dalenbäck-94] "A Macroscopic View of Diffuse Reflection," B.-I. Dalenbäck, M. Kleiner, P. Svensson, JAES 42, 973-807 (1994) [Dalenbäck-95] "The Importance of Diffuse Reflection in Computerized Room Acoustic Prediction and Auralization," B.-I. Dalenbäck, Proc. IOA 17, 24-34 (1995).
Reverberation time, diffuse reflection, Sabine, and computerized prediction - part II. Bengt-Inge Dalenbäck, Ph.D., CATT
0. Introduction This is the second part of a two-part on-line paper discussing reverberation time estimation with special emphasis on the effects of diffuse reflection in computerized prediction (CP) in relation to classical Sabine methods. The purpose of this paper is to discuss problems, pitfalls and techniques regarding reverberation time (RT) prediction and gives examples from idealized as well as actual rooms encountered in consulting practice. Part I addressed:
No not always. As indicated in part I, for mixing room shapes the RT can be well predicted even without diffuse reflection (even if prediction of finer parameters such as C-80 may suffer). However, the central question is then: how can it be known in advance if a room shape is mixing? The answer is that it cannot, at least not just from inspecting the room shape except in some extreme cases where it can be deduced that the shape is not mixing. There is no reason not to include scattering in a CP program, it will only mean an unnecessary uncertainty and a potentially dramatic overestimation of the RT. 2. How can diffuse reflection be handled in a CP program? The most common way for CP programs to handle diffuse reflection is by randomizing the direction of reflected rays according to some distribution [Kuttruff]. The procedure is as follows: when a ray is to be reflected from a diffusing surface a random number A in the range 0 to 1.0 is generated. If this number is higher than the scattering coefficient s of the surface the reflection is specular, if it is lower the ray will be diffusely reflected (if the scattering coefficient is 0.30 then 30% of the rays that hit the surfaces will be diffusely reflected and 70% will be specularly reflected). If the value of A was such that the reflection should be diffuse, two new random numbers, B and C, are generated that decide in which direction the ray should be reflected according to the direction distribution function used. 
The most common diffuse reflection distribution
function is that of Lambert (ideal diffuse reflection, often used in optical
ray-tracing) [Kuttruff]. Although there are reasons
to claim that Lambert is not a good function to use, since it originates
from optics where the wavelengths are much smaller than in acoustics, it is
a distribution for which a lot of experience has been collected since it
has been - and still is - used in most CP programs that handle diffuse reflection.
CATT-Acoustic™ v7 and v8 employed
Lambert as described for two calculation methods: "Audience area mapping"
that is based on ray-tracing with fixed-sized receiver spheres and in "Full
detailed calculation" that is based on the unique Randomized Tail-corrected
Cone-tracing (RTC). However, the RTC uses the described procedure only for
reflection orders greater than one. However, the RTC uses the described procedure only for reflection
orders greater than one. CATT-Acoustic™ v9 also employes Lambert (and Lambert 1D) as described for two calculation methods: "Audience area mapping" that is based on ray-tracing with fixed-sized receiver spheres and in "Predict SxR" in TUCT that is based on a mix of Cone- and ray-tracing not requring any tail-corretcion. For first (v9) and second (v8) order specular reflections, the image source model is used while first order scattering is handled by distributing many small sources over each diffusing surface. To have the highest geometrical accuracy where it is needed, the lower the absorption coefficient and the higher the diffusion coefficient the more surface sources are used. From the actual sound source, vectors are drawn to each diffuse surface source and from each of those to the receivers (taking occlusion into account), figure II-2 illustrates the procedure. 
a) 1st order specular and diffuse reflections 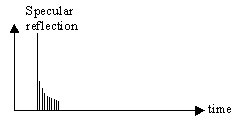
b) Schematic echogram Receiver 1 (direct sound not shown). Specular reflection is attenuated by (1-s) 
c) 1st order diffuse reflections 
d) Schematic echogram Receiver 2 (direct sound not shown) Figure II-2 Procedure used to calculate first order diffuse reflection in the RTC. a), b) receiver in specular zone, c),d) receiver outside specular zone. The strength of each diffuse reflection is, according to Lambert, proportional to the cosine of the incidence angle as well and the cosine of the reflection angle (as measured towards the surface normal). However, since there are many surface sources, all with different incidence and reflection angles, the total effect for surfaces of some size is not that of a cosine directivity but rather something that is quite similar to a QRD diffuser. This method will, as is indicated in figure II-2 give the smear of reflections in time and many other properties of real diffusers if not in a detailed manner. It would be possible to use distribution functions measured from actual diffusers and that is a likely future development for CP programs. 3. Must diffuse reflection be handled with frequency dependence? Since diffusion is strongly related to the ratio between surface roughness/size the obvious answer is Yes. Figure II-3 shows a schematic illustration of how the ratio affects diffusion. 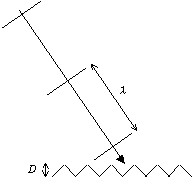
a) wavelength >> D : low diffusion
Figure II-3 Schematic description of how the ratio between surface roughness and wavelength determines the diffusion (D is a typical size of the roughness). This is of course a simplification but it
illustrates the necessity to handle scattering with frequency dependence.
In addition, available measurements such as on the RPG site clearly indicate
that a single value for all bands will not suffice. Indeed, for some diffuser
designs, the diffusion coefficient may vary more with frequency than its
absorption coefficient does, this behavior may also be carried over to the
scattering coefficient. Here is a good place to discuss the difference between
the diffusion coefficient and the scattering coefficient:
4. How can scattering coefficients be estimated? This is likely to be the "FAQ of all FAQs" regarding software like CATT-Acoustic™ that handles diffusion and the answer is a combination of good and bad news. The bad news is that there exists no tables of data nearly as well spread and accepted as those for absorption coefficients. The data that does exist so far covers mainly commercially available diffusers and lists mainly the diffusion coefficient but the scattering coefficient for (say) a coffered ceiling or a statue will typically not be found, at least not in the near future. It is more complex to measure a diffuser than an absorber, at least more difficult than the random incidence absorption coefficient mostly used in RT calculations. One of the reasons is that the diffusion coefficient will vary with the size of the diffuser (a problem also present with absorbers but to a lesser degree) and another that a diffuser will typically not diffuse equally in all directions. The ISO project group [ISO-2000] has developed a measurement procedure to measure a random incidence scattering coefficient but regarding e.g. size dependence it has similar difficulties (perhaps especially so for practical reasons since the method involves rotating a sample). So, what can then possibly be the good news? For RT estimation purposes the scattering coefficients do not have to be very detailed and a bit of physical reasoning will in most cases suffice! For ordinary building elements the following scattering coefficients are recommended (note that CATT-Acoustic™ coefficients are entered as % values 0..100 (ABS) or fractions 0..1 (ABS1).
We now return to the sports hall from Part
I where the acoustic consultant did a series of prediction tests to investigate
what scattering coefficients would have given the measured T-30 in the initial
case (5.7 sec) and the result was around 0.10 as is in accordance with the
general recommendation above of 0.10 for large flat walls (here some fittings or similar were
present). Worth mentioning here is that the ceiling beams can be handled
by auto edge diffusion. Table II-1 shows various predicted RT values for
the 1 kHz octave-band where the Sabine and the specular-only CP cases form
the low and high extremes while the CP values with diffusion taken into
account are close to the measured one.
Table II-1 Measured and predicted RT values @ 1 kHz for the sports hall from Part I. The sports hall also has another smaller, but still significant, estimation problem since nearly 90% of the surface in the detailed case is concrete. This means that the late decay (affecting T-30) is very dependent on the exact value of the absorption coefficient selected for concrete. Consider these two cases:
To conclude, this simple-looking sports hall actually demonstrated a range of problems regarding RT prediction and to arrive at 10% from the measured value is quite good, especially in relation to the very large errors given by the Sabine formula or a specular-only prediction. However, rooms that are more mixing and that have a more even absorption distribution, are not as sensitive to scattering settings and tend to be considerably easier regarding prediction. 5. How will diffuse reflection affect auralization? This short two-part paper about RT estimation and diffusion in CP programs has focused on what the author considers to be a first order effect of diffuse reflection when it comes to estimation of objective parameters such as the RT. However, with auralization also the subjective impression counts. There has not been many listening tests made regarding this but a fairly recent one involving CATT-Acoustic™ indicated that when scattering coefficients were varied listeners perceived the changes in an expected manner [Torres-00]. Basically, for the listener position studied, the article showed that:
[AES-4id-2001] JAES 49(3), 149-165, 2001
|
||||||||||||||||||||||||||||